Chullora Sydney East AQI: Chullora Sydney East Real-time Air Quality Index (AQI). |
- | no data - temperature: -°C |
| current | past 2 days | min | max | ||||||||||||||||||||||||||||||||||||||||||||||||||||||||||||||||||||||||||||||||||||
Weather Information | |||||||||||||||||||||||||||||||||||||||||||||||||||||||||||||||||||||||||||||||||||||||
Temp. | 25 | 19 | 34 | ||||||||||||||||||||||||||||||||||||||||||||||||||||||||||||||||||||||||||||||||||||
Pressure | 1019 | 1007 | 1019 | ||||||||||||||||||||||||||||||||||||||||||||||||||||||||||||||||||||||||||||||||||||
Humidity | 64 | 37 | 94 | ||||||||||||||||||||||||||||||||||||||||||||||||||||||||||||||||||||||||||||||||||||
Wind | 2 | 1 | 9 | ||||||||||||||||||||||||||||||||||||||||||||||||||||||||||||||||||||||||||||||||||||
Rain | 1 | 1 | 1 | ||||||||||||||||||||||||||||||||||||||||||||||||||||||||||||||||||||||||||||||||||||


map © OpenStreetMap contributors
Air Quality Forecast
Forecast plotted using timezone +11:00
Latest forecast updates:
Wind: 2 years ago [Feb 18, 2023 11:09 PM]
fine particulate matter: 2 years ago [Feb 18, 2023 11:48 PM]
ozone: 2 years ago [Feb 18, 2023 4:39 PM]
Wind: 2 years ago [Feb 18, 2023 11:09 PM]
fine particulate matter: 2 years ago [Feb 18, 2023 11:48 PM]
ozone: 2 years ago [Feb 18, 2023 4:39 PM]

Air Quality Data provided by: the Office of Environment and Heritage - NSW (environment.nsw.gov.au)
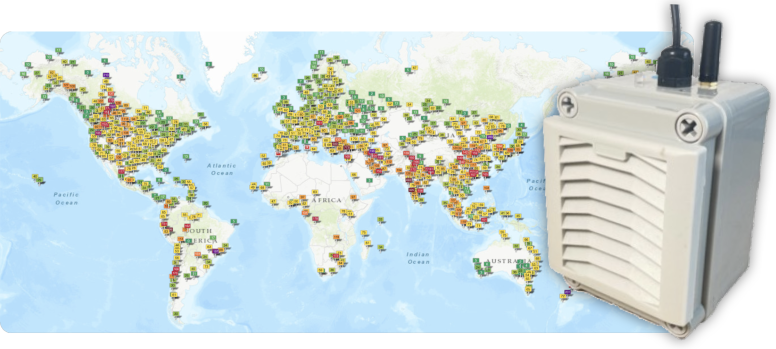
Do you know of any Air Quality stations in your area? why not participate to the map with your own air quality station?
> aqicn.org/gaia/ <
Share: “How polluted is the air today? Check out the real-time air pollution map, for more than 100 countries.”
Share: “Chullora Sydney East Air Quality is Not Available - on Thursday, Jan 1st 1970, 09:00 am”
https://aqicn.org/snapshot/australia/nsw/chullora/sydney-east/19700101-09/?cs
Cloud API
This air quality monitoring station real-time data can be programmatically accessed using this API url: (For more information, check the API page:aqicn.org/api/ )
