世界大気汚染指数チームへのお問い合わせ

The World Air Quality Index project is a non-profit project started in 2007. Its mission is to promote air pollution awareness for citizens and provide a unified and world-wide air quality information.

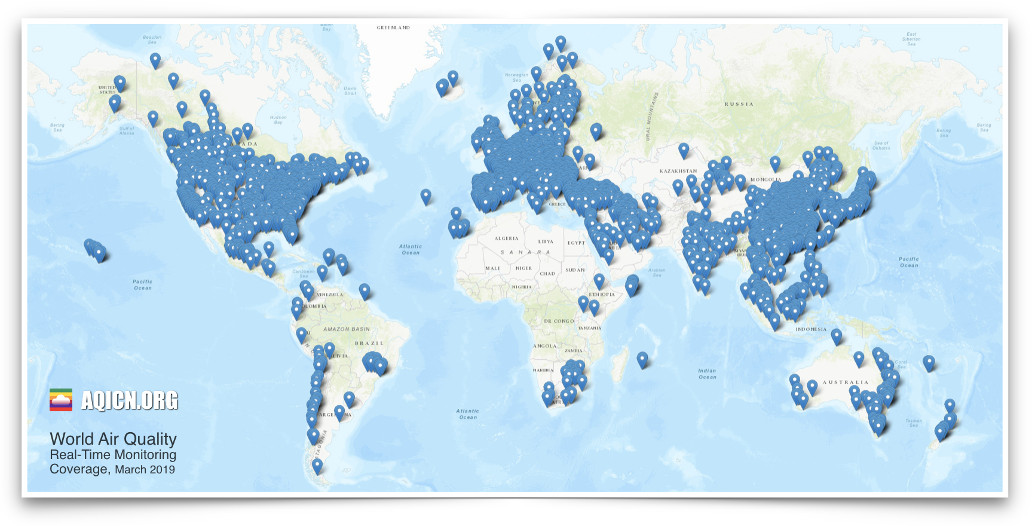
The project is providing transparent air quality information for more than 88 countries, covering more than 11,000 stations in 1000 major cities, via those two websites: aqicn.org and waqi.info.
The founding team, located in Beijing China, is composed of several contributors in the domain environmental sciences, system engineering, data science, as well as visual design. The team has been expanding worldwide, with new key supporters from Singapore, India, Australia, USA.

The project, despite its social intent and expensive outreach, has never received any public funding. The limited income, essentially from online ads, is used to cover the infrastructure and hardware cost. Engineering work is contributed.
The project is constantly looking for support from more contributors. It has now received active contributions from more than 12335 citizens from 123 countries:
Loading contact form...

Due to our small team limited capacity we can not guarantee replying to all messages. Instead, please use the following dedicated contact pages:
  • If you are from an EPA or want to submit/update an air quality data feed, check the data feed page.
  • If your country or city is not covered on the map, but you'd like to, check the new coverage page.
  • If you want to contribute and help promoting air quality awareness, check the contribute page.
  • If you want to setup your own air quality station, check the air quality sensor / monitoring page.
  • If you need access to the air quality data from our map, check the API and/or data platform pages.
You can also refer to the common list of questions and answers below.

You can also visit us on facebook.com or twitter.com

made in 北京

Share: aqicn.org/contact/jp/

Credits


最初期にPM2.5大気汚染測定データを提供、公開してくれた在中国米大使館に我々は感謝しなければなりません。そして、数多くの都市のPM2.5情報を提供するために多大な努力を重ねる中国環境保護部と、大気汚染を監視しその情報を提供する素晴らしい業務をこなす世界中の環境保護機関の皆さんにも。

All this work is made possible thanks to the excellent work for the worldwide EPA (below list not exhaustive):

--

We are looking for help to translate this website. More information, please check the translation page.

Common question & answers

  1. Air Quality Data sources: All the Air Quality data seen on World Air Quality Index are the official data from each country respective Environmental Protection Agency (EPA). Data from each EPAs is measured using professional monitoring equipment. The full EPA source list used in World Air Quality Index is available from sources page.
  2. Seeing different readings from other websites: This is most likely normal, and due to the fact that different websites use different AQI scales present the data. At World Air Quality Index, we are using the US EPA scale, while other website might use different scales. Check this article for more information.
  3. I want to monitor the air quality in my area: As high-end professional stations can be really expensive (more than $10K per stations), the World Air Quality Index project / Earth Sensing Labs has designed specialy optimized and affordable monitoring stations costing as low as $200. Please check the GAIA air quality monitoring station product page.
  4. I want to add a new station on the map: Provided your monitoring station is qualified (for instance if it is using BAM, TOEM or GAIA technology), then adding a new station on the map is not only simple and straightforward but also completely free. Please refer to this page for the full explanation
  5. Data quality & real-time validation: The data published on World Air Quality Index is real-time and therefore unvalidated at the time of publication. In order to strengthen the quality, a set of real-time AI algorithms are used to detect abnormal data conditions (sparks, low reporting, etc.) and automatically 'disable' data reported from defective stations.
  6. Historical data access: We are currently investigating with several international institutions (WHO, UN, GEO) the possibility to setup a framework for accessing the historical Air Quality data. If you are from an international institution, organization or university and want to join this effort, then check our data platform page.
  7. API (Application Programing interface): The World Air Quality Index project is offering a free API for maps, tiles and programatic JSON access. Check the API page for more information.
  8. Contributing to the World Air Quality Index project: The project is always looking for more hands to support the activities: For instance, to write articles, to improve our applications, to create new data visualization, to improve the air quality forecast or to translate the website and app to news languages. Check the contribute page for more info.
  9. Fundings: The World Air Quality Index project is independent from any governement and any "profit" corporation. It has so far not received any fundings from any public nor private entity. The limited income from online ads is used to cover infrastructure cost.
  10. Why chosing the U.S. EPA index to harmonize the data? This is mostly for historcal reason: When we started in 2007, there was not so many alternative, and the US EPA was actually quite proactive at promoting the idea of clean air, so the choice was natural. Some alternatives, such as the European “Common Air Quality Index” could also have been a good option, but the EEA failed to promote their standard. This won't be a problem for long anyways, since we are now working on a improvement which will allow users to select any scale they want among a list of more than 80 scales!
  11. How many cities do you currently provide air quality data for and is the info available on your app in each of them? We are providing the data for 9000 stations worldwide ~ that’s around 600 major cities in 70 countries. The info is available in the app for each of them, but not all of the cities have the “full” set of pollutant monitoring (e.g. PM2.5, PM10, Ozone, NO2, SO2, CO). For example, some only have PM10 or a composite AQI. We are also continuously increasing the coverage, targeting to get 10 to 20% more stations every year. The full list of cities and stations is available from this page.
  12. Media kit? Our public media kit is available from the media kit page.
Any other question, please check the Frequently Asked Question page.

made in 北京


大気汚染ランキング

大気汚染指数の測定方法:

大気汚染レベルについて

指数 大気質指数の分類(米国) 健康影響 / カテゴリ 粒子状物質(PM10,PM2.5)
0 - 50 良い - Good 通常の活動が可能 なし
51 -100 並 - Moderate 特に敏感な者は、長時間又は激しい屋外活動の減少を検討 非常に敏感な人は、長時間または激しい活動を減らすよう検討する必要がある。
101-150 敏感なグループにとっては健康に良くない - Unhealthy for Sensitive Groups 心臓・肺疾患患者、高齢者及び子供は、長時間又は激しい屋外活動を減少 心疾患や肺疾患を持つ人、高齢者、子供は、長時間または激しい活動を減らす必要がある。
151-200 健康に良くない - Unhealthy 上記の者は、長時間又は激しい屋外活動を中止
すべての者は、長時間又は激しい屋外活動を減少
心疾患や肺疾患を持つ人、高齢者、子供は、長時間または激しい活動を中止する必要がある。それ以外の人でも、長時間または激しい活動を減らす必要がある。
201-300 極めて健康に良くない - Very Unhealthy 上記の者は、すべての屋外活動を中止
すべての者は、長時間又は激しい屋外活動を中止
心疾患や肺疾患を持つ人、高齢者、子供は、全ての屋外活動を中止する必要がある。それ以外の人でも、長時間または激しい活動を中止する必要がある。
300+ 危険 - Hazardous 上記の者は、屋内に留まり、体力消耗を避ける
すべての者は、屋外活動を中止
全ての人が屋外活動を中止する必要がある。特に、心疾患や肺疾患を持つ人、高齢者、子供は、屋内に留まって激しい活動を避け静かに過ごす必要がある。
(Reference: see wikipedia, and cn.emb-japan.go.jp/)

大気汚染についての更なる詳細をお知りになりたい方は、WikipediaAirNowを参照してください。

北京在住の医師Richard Saint Cyr氏による大変役に立つ健康上のアドバイスは、 www.myhealthbeijing.com をご覧ください。


使用上の注意: すべての大気質データは公開時点では妥当性が担保されていないため、これらのデータは予告なしに修正することがあります。 世界大気質指数プロジェクトは、この情報の内容を編集に最善の注意を尽くしておりますが、いかなる状況においても World Air Quality Index プロジェクトチームまたはそのエージェントは、このデータの供給によって直接的または間接的に生じる損失や損害について責任を負いません。


設定


言語を選択:


Temperature unit:
Celcius